BFCM 2024 trends were driven by AI features, new-to-market offers, and opt-in wins. Read up for guidance on what to test onsite and how different industries made it out of Q4 2024. Justuno users had quite a season with tons of shopping data points & shopping patters collected to learn from. To set the stage, the top performing 10% of Justuno customers who have fully optimized their website experience had an average sales conversion rate of 49.7% (in comparison, Justuno’s average customer achieved 14.5% CVR, industry average 2.5%). Skip ahead to see performance by industry below.
Key Ways They Achieved This 49.7% CVR:
1. Cart Abandonment By SKU 🛒
This strategy delivered a 67.7% engaged conversion rate; meaning 67.7% of exiting visitors with specific items in their carts who saw an exit pop-up converted into a sale. This should stop you in your tracks. If you aren’t running at least a cart abandonment pop-up you’re leaving money on the table. Double points if you’re segmenting it by SKU, price, etc. even better. This will print you money in 2025.
2. Returning Abandoned Window Shopper 👀
The BFCM 2024 window shopper was one of the most targeted segments due to the growing concern over retention for many brands. This strategy delivered a 37% engaged CVR. There is lots of price comparison shopping during the holidays so targeting these returning visitors is an obvious win. Do this during your brand’s busy times next year for an easy ROI.
3. Gamification For New & Return Visitors 🎲
Gamification pop-ups delivered a 13% CVR—while we normally say keep it simple for BFCM in 2024 games were a winner! Adding this playful element keeps shoppers engaged and your brand top of mind.
4. Product Recommendations Throughout Site 🛍
Coming in with a 21.9% engaged CVR this personalization tactic was key in helping product discovery and gifting shoppers figure out what they want. By placing intelligent product recommendations throughout your website you’re ensuring that at every touchpoint there is an opportunity for additional revenue and optimization.
What Part Did AI Play In BFCM 2024?
We had users lean into AI-driven embedded product recommendations across the site + the addition of segmentation based on traffic source and visitor personas. This means more carousels with curated products were served up across the site—from the home page to the cart page and post-purchase. For BFCM 2024, the data exposed an increase in the adoption of smart recommendations in multiple locations on-site. We saw the AI-driven recommendations lead in the category of features added to popups—a category that also houses spin-to-win, tap-to-text, countdown timers, and text tickers for multi-message popups.
Leading up to the holidays, most websites opt to use an upsell algorithm or items from a certain category to improve metrics like AOV per channel or product discovery. But the algorithms that really piqued marketers’ interest (and ROI) this season included the Last Abandoned Cart Items which yields higher converting return visits, and the cross-sell carousel of products. With the option to add or remove any SKUs to these carousels, brands were able to focus on moving the exact products they wanted to reach AOV goals and support inventory efforts.
What to test: Here are some suggestions for where and when to use each of Justuno’s five AI algorithms for your next A/B test.
[How long does it take to run a test? Aim to achieve ⅔ of these to find your winners: ]
- Whenever you reach statistical
- At least 10,000 [unique] sessions worth of data
- 30 days worth of data
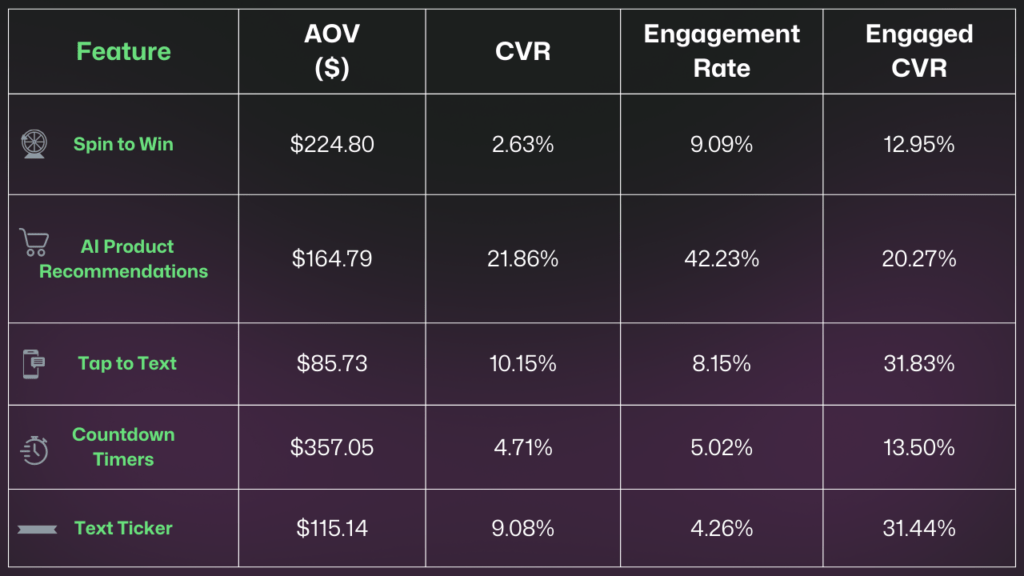
⭐️⭐️⭐️⭐️⭐️ 5-star experiences had one influential factor that drove more BFCM shoppers to cart→ product recommendations that pull from real-time session data. The AI feature that feeds product recommendation carousels on Justuno, led the feature pack with the highest conversion rate at 21.86% (when compared to other features in the table above). What we take from this is the power of relatable recommendations and their relation to sessions with higher engagement rates and higher conversions per channel. This year, product recommendations had the highest increase in adoption from last year.
Top Features + Hidden Gems
A typical question a marketer may ask us during the holiday season, or BFCM more specifically, is on the topic of how to make pop-ups more engaging and effective. This season the top two features to do this were gamification and urgency via timers. These two features are powerful together but can also stand on their own. What we will point out is that these two features contributed to higher AOVs compared to other features such as tap-to-text, text ticker carousels, and product recommendations.
The way we advise looking at AOV improvement and pop-up strategy is to first identify how each traffic source is behaving. You can do that quickly with a custom dashboard from Justuno.
Step One: Group high AOV traffic and low AOV traffic separately to audit AOV differences, items added to cart, and any similarities between source messaging and shopping journey (aka which pages are often visited, or top exited pages).
Step Two: Target the key touchpoints (on-site touchpoints = welcome to the site, exit site, cart abandonment, return visit & post-purchase) that will have the most impact on this traffic. What that impact is or looks like is up to you and the data. Could be that you want to increase engagement in general, or coupon code use may be a priority to reduce any checkout friction. Website navigation on site may be clunky or perhaps visitors need a little push to see the content you want them to see. That’s where a touchpoint like abandonment needs to be addressed. If a visitor is abandoning your site that’s when you should enable a great gamified design where they can pick their own prize like this example or even spin a virtual wheel to win the best prizes (spin to wins had a 12.95% conversion rate this season!).
What to test: Set up a Justuno workflow that has branches for your top two to five traffic sources AKA those that drive the most visitors. Then test different designs, offers, targeting conditions, or messaging for each source.
Here’s some additional direction for testing difficult elements:
Design 🎨
- Test branding approach with colors, layout, and position (example: center pop-up vs. full page takeover or corner slide out)
Offers 🤑
- A classic % off vs. loyalty points offer approach tends to deliver a clear winner. With AOV-related offers, we see success when you use something like “20% off orders over $75” vs. “2000 bonus points on orders over $75”
Conditions 🎯
- Start by identifying the touchpoint that needs the most help (on-site touchpoints = welcome to the site, exit site, cart abandonment, return visit & post-purchase). Next, review site behavior like average pages traveled on-site or top exited pages to determine when the best time is to catch your visitor before you’ve lost their interest.
Messaging 💬
- With pop-ups, it’s more about getting the quick message across the screen vs. a wall of text with tons of details. If they are interested they will click through. So focus on your presentation of the message, how you use the space, and where you draw their attention on the screen. This is especially important when you have visitors clicking through from ads or specific influencer campaigns.
BFCM Opt-In Trends: Form vs. No Form Performance
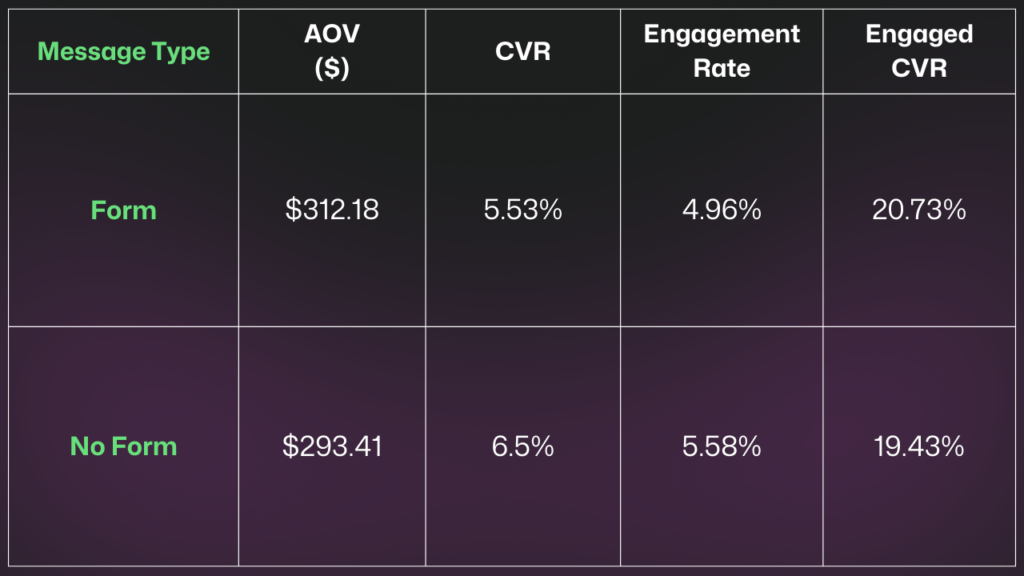
On the topic of AOV, we have to address the form vs. no form debate. The BFCM trend we saw: pop-ups with forms barely leading with an AOV of $318. Not far behind, pop-ups without forms had an average order value of $297.
During the holiday season, we recommend prioritizing the conversion and pausing your lead captures as the priority. That means you create ungated versions of your pop-ups that make offer redemption easy and sale details clear. Pausing the main lead capture only means that the visitor will have to click into a corner tab to reveal the lead capture or perhaps an embedded experience is the way to go. In this scenario, your sales pop-up shines to deliver a top-notch converting experience.
An advanced lead capture use case we saw brands adopt this past season combines the product recommendation feature with lead capture quizzes to deliver the ultimate product discovery quiz. This is a great variation B to use for your next lead capture test because you’ll see what engagement can help yield in revenue.
Another way to approach list growth strategy and implement a level of segmentation in your campaigns is to target new and return visitors separately with their own flow of pop-ups. Brands implementing this level of segmentation contributed to the notable increase in engaged conversion rate—up ~47% from 2023 on mobile devices, and up ~36% on desktop.
2024 Offer Redemption: Coupon Codes vs. No-Coupon Codes
Coupon code redemption can cause some stress among teams if not audited and managed correctly. This season brands took advantage of our auto-sync feature with e-commerce platforms that allow for unique codes to pull into pop-ups in real time. Brands could also choose from auto-applying codes at checkout vs. no auto-apply. We noticed that the decision came down to personal preference usually or based on previous negative experiences with codes.
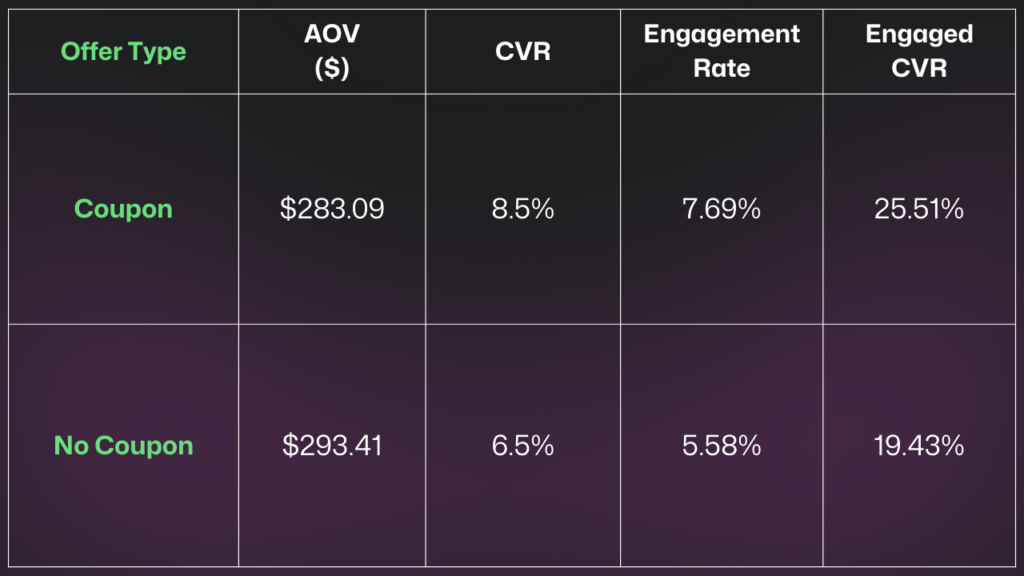
We saw coupon code adoption spike 24.45% from 2023—supporting the feedback that coupon code redemption was easier than most years as it relates to pop-ups.
What we like to encourage is a multi-channel distribution of a code. Some like to present the offer in the pop-up and the code only via email or only via text. And that’s such a fragmented experience and feels like the opposite of trying to meet the customers where they are. If they are on the website, make that the priority channel and create a seamless offer redemption journey. We’ve proven that It’s not hard to give the same coupon code across channels. It’s just that most people don’t have the time to fully audit a journey on site and this is easy to miss if you’re only focused on one or two channels.
Pop-ups that presented a code element had an average conversion rate of 8.5%. While no-coupon pop-ups saw an average 6.5% conversion rate. The consensus was that the clarity of the coupon code and offer details made it easier to continue shopping on-site this holiday. Continuing a good level of communication with customers and return visitors is crucial in January as you aim to keep new visitor journeys toasty warm.
More about what variations to test when it comes to codes here.
BFCM Device Performance: Desktop vs. Mobile Shopping
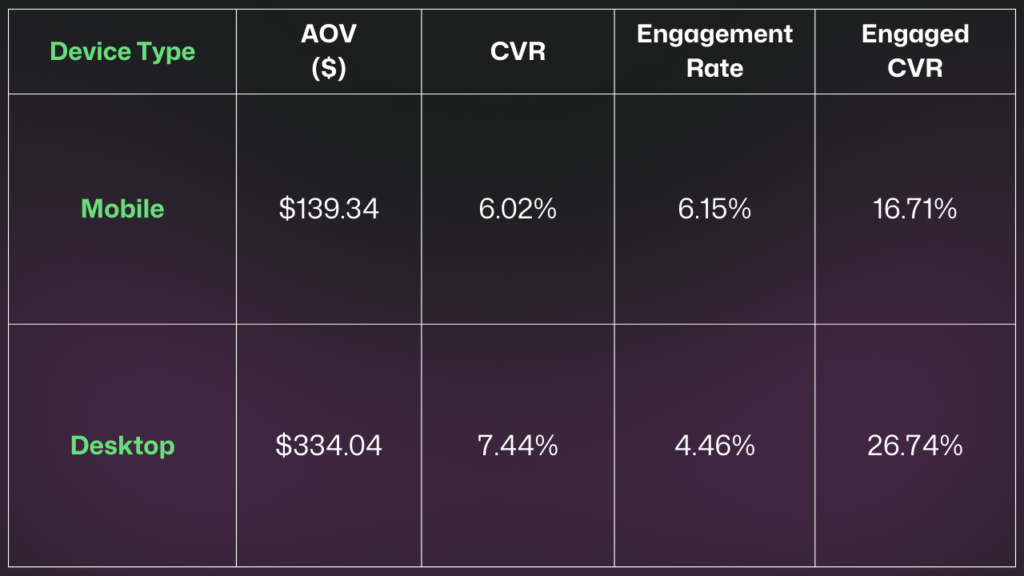
Desktop experiences saw an impressive 7.44% average conversion rate. And mobile experiences held their own with a 6.02% average conversion rate—up 19.44% from 2023. Desktop is really where engagement lived. We saw a 26.74% engaged conversion rate among desktop shoppers and a 16.71% engaged conversion rate on mobile. What is so impressive about mobile is the 47.22% increase in engagement rate from 2023. Marketers took mobile UX advice seriously by spending a good amount of time designing for mobile screens and understanding the differences between mobile journeys and desktop journeys.
Seeing the differing BFCM performance rates on desktop and mobile supports the need for fluid campaigns. For example: mobile experiences had a higher engagement rate but desktop still had a higher conversion rate and AOV at the same time. With shoppers hopping from channel to channel the name of the game was repetition and variation. It was as simple as creating one design that becomes responsive as soon as you design it to accommodate both desktop and mobile shopping in one act. A common metric our team expertly strategizes around is a low conversion rate on mobile. What we’ve realized through testing is that mobile shopping benefits from strategies that aim to increase time on site, improve site navigation, and reduce current-session cart abandonment.
What To Test: Set up a Justuno workflow that contains a branch for mobile visitors and a branch for desktop visitors. Test different timed conditions like scroll percentage, time on site, pages traveled, or current page to show the highest converting offer to the most visitors (only the qualified ones of course).
Some testing scenarios to start with:
- 50% scroll vs. 10% scroll – review for change in engagement or engaged conversion rate
- 5 seconds vs. 10 seconds – review for change in engagement rate, bounce rate, drop off rate.
- 2 pages vs. 3 pages traveled – review average page traveled by device type. And then by traffic source if you want to narrow it down.
BFCM 2024 Pop-up Winners
To wrap this up we’re giving you an industry breakdown on key metrics plus a treat from our team highlighting their favorite and most effective designs. Take a peek at branded design execution and why they caught our eye.
Chomper Treat Box – First of all, cuteness overload. Branded colors are subtle and nothing about this is annoying. On the design side, you don’t need to spend too much time updating a template. You can pull in a stock photo from our unsplash integration or you can upload a brand image. In this case, there’s more strategy than you’d expect. The pup’s face is being used to direct your eye to the email address field and keep your attention that much longer. Bravo 👏
Listen to your gut – Snow animation + text ticker feature for multi-message style banner + an intriguing CTA. And we should add that no dev was used in the making of this banner. What we love about this is how easy it is to duplicate and update the messaging to fit various traffic sources’ click-through expectations.
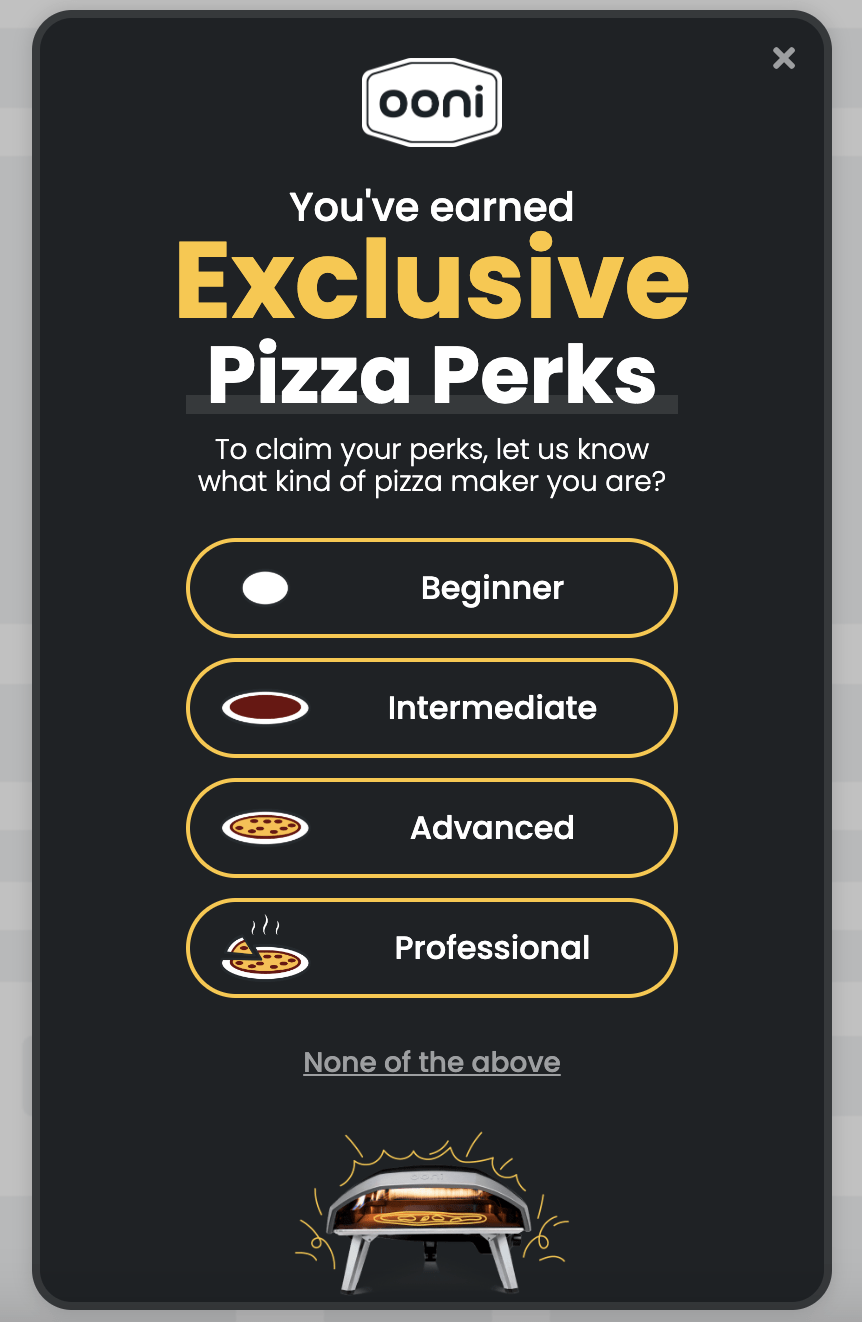
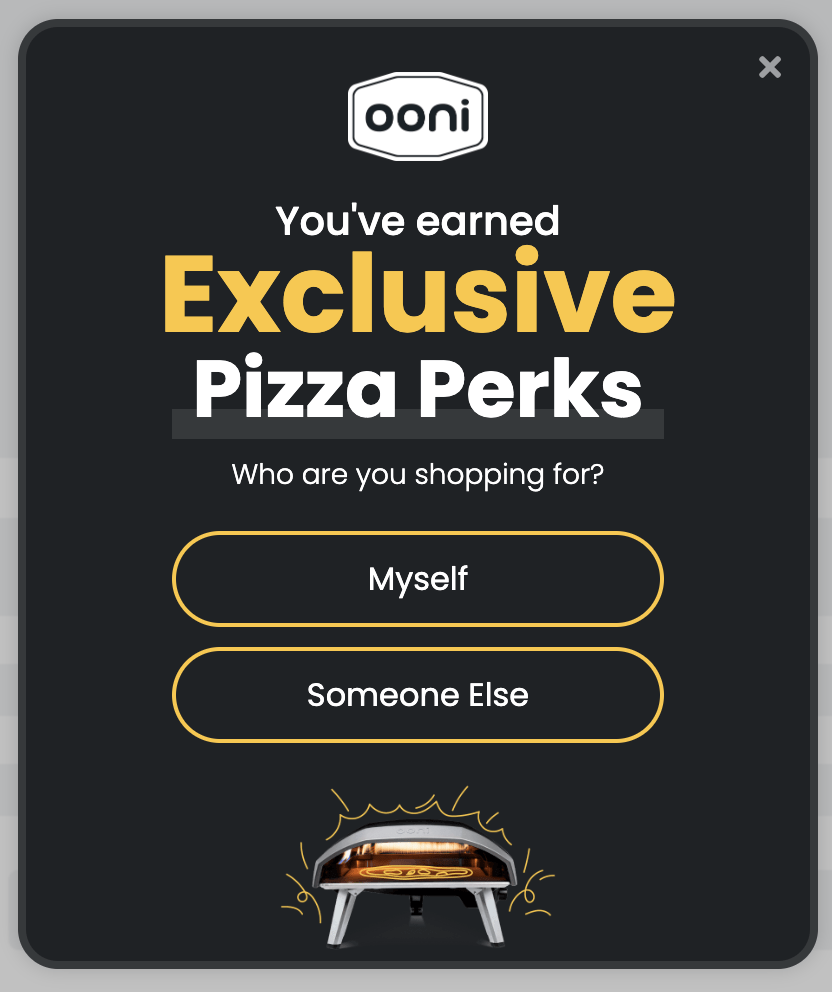
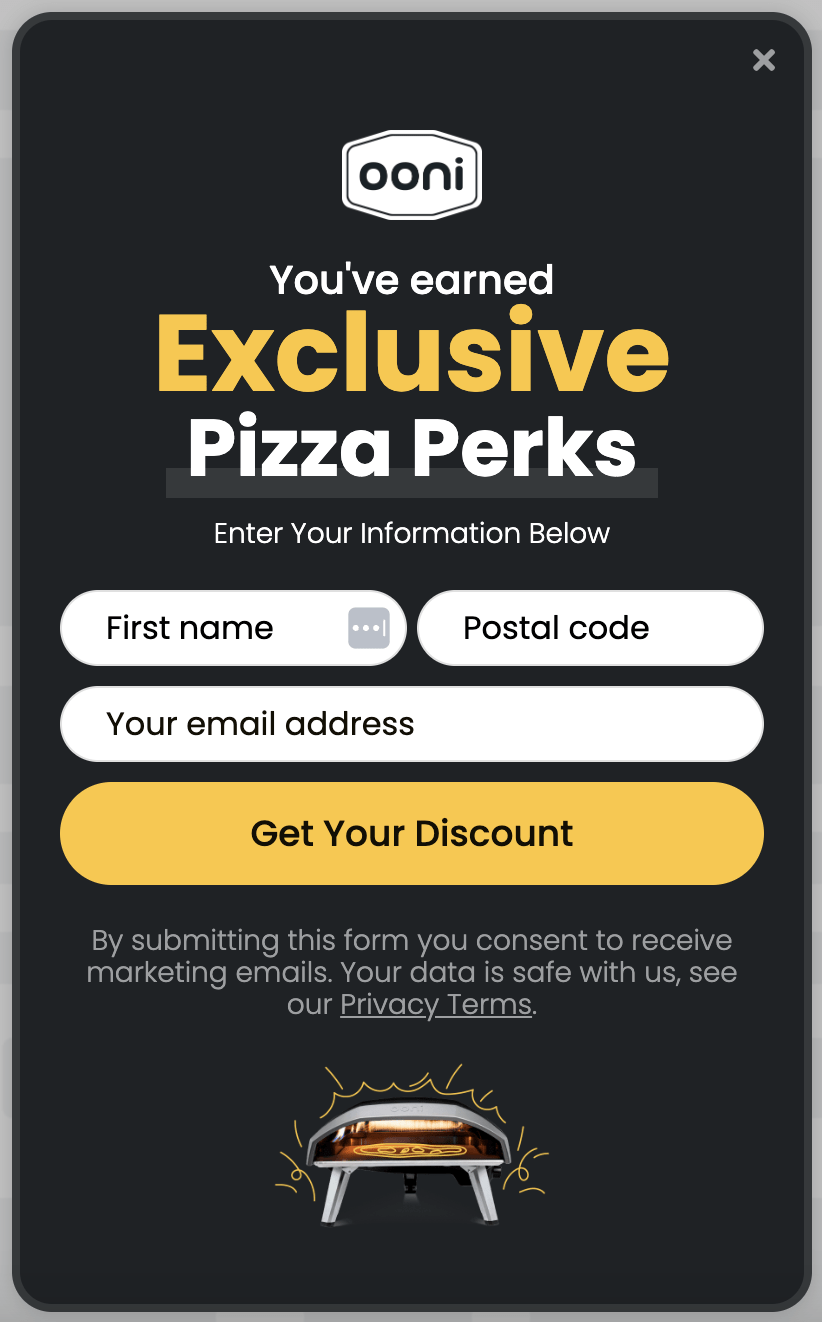
ooni – The total brand alignment here is superb. We’re calling this one out due to the next-level CTAs and question type. Two to four buckets for segmentation is a great place to start when you begin using quizzes or surveys on-site. In three frames they prioritized geolocation and self-identification questions that set a great foundation for building a visitor profile that you can retarget on and off-site.
Listen to your gut – Making the list for a second time means they really didn’t miss this season! Product recommendation carousels can be so lackluster without that extra effort. They chose the route of proactively showcasing products and improving product discovery and time on-site with relatable promotion based on the current page they were on. They also took the product recommendation feature to the next level by using the quick [add to cart] CTA for seamless continued shopping.
Industry Performance
| Conversion Rate | AOV ($) | Engagement Rate | Engaged Conversion Rate | |
| Animal & Pet Care | 1.36% | $178.14 | 2.91% | 9.46% |
| Automotive | 4.95% | $295.84 | 10.84% | 13.61% |
| Beauty & Cosmetics | 9.61% | $123.87 | 6.81% | 19.95% |
| Collectibles, Hobbies, & Toys | 18.89% | $129.49 | 20.60% | 51.27% |
| Construction & Contracting | 3.17% | $454.79 | 4.68% | 21.72% |
| Education | 11.08% | $68.79 | 3.52% | 26.85% |
| Fashion & Apparel | 4.90% | $160.60 | 5.19% | 18.02% |
| Food & Beverage | 7.76% | $81.26 | 6.94% | 16.60% |
| Health & Fitness | 7.73% | $605.00 | 2.34% | 19.83% |
| Home & Garden | 6.07% | $340.46 | 4.88% | 25.45% |
| Jewelry & Accessories | 5.05% | $266.63 | 10.45% | 2.15% |
| Logistics and Supply Chain | 15.22% | $14.55 | 26.09% | 0.05% |
| Media & Entertainment | 0.54% | $173.88 | 1.48% | 55.08% |
| Outdoor & Sporting Goods | 6.20% | $432.63 | 7.76% | 13.19% |
| Regulated & Adult Industries | 10.13% | $62.01 | 7.83% | 69.48% |
| Sports Teams & Clubs | 0.93% | $83.26 | 1.80% | 950.00% |
| Technology & Computing | 2.81% | $464.83 | 8.01% | 2.39% |
Try us out with a free 14-day trial or schedule a demo to see how Justuno can take your on-site strategies to the next level. Mention this blog to get free onboarding 🥳️
